2024-11-06
QUALCOMM Financial Report 2024 Q4
Company Description
Qualcomm operates in the semiconductor and wireless technology industry, developing and commercializing foundational technologies for mobile devices and other wireless products. Their core strengths lie in 5G technology, high-performance computing, and on-device AI. Key products include Snapdragon platforms and RFFE components.
Industry trends include the growth of AI capabilities in edge devices, advancement of 5G and connectivity technologies, and expansion into automotive and IoT markets. Challenges include intense competition, customer vertical integration, and U.S.-China trade tensions.
Qualcomm's strategy focuses on maintaining leadership in 5G, expanding into new industries beyond mobile, and driving adoption of their technologies in automotive and IoT applications. Recent initiatives include developing on-device AI capabilities, extending their licensing programs, and investing in next-generation wireless technologies.
The company is responding to market conditions by diversifying revenue streams, investing in R&D for emerging technologies, and navigating geopolitical challenges while maintaining strong relationships with key customers and partners.
Business Highlights
Qualcomm's performance highlights in fiscal 2024:
QCT (semiconductor business): Revenues increased 9% due to higher handsets and automotive sales, partially offset by lower IoT revenues. This was driven by increased chipset shipments to major OEMs and growth in automotive products.
QTL (licensing business): Revenues rose 5% from higher estimated sales of 3G/4G/5G multimode products. The increase was partially offset by lower per-unit revenues and the end of certain upfront license fees.
QSI (strategic investments): EBT improved significantly due to gains on non-marketable equity investments. This segment makes strategic investments to open new opportunities for Qualcomm's technologies.
Overall, Qualcomm saw 9% revenue growth and 40% net income growth in fiscal 2024 compared to 2023. The company benefited from 5G adoption, diversification into automotive/IoT, and higher interest income, while managing restructuring costs.
Income Summarization
Qualcomm demonstrated strong financial performance in fiscal 2024, with revenues increasing 9% to $39.0 billion and net income surging 40% to $10.1 billion. The QCT segment, which accounts for 85% of total revenue, grew 9% to $33.2 billion, driven by higher handset and automotive sales. QTL revenues rose 5% to $5.6 billion, benefiting from increased 3G/4G/5G device sales. Both segments expanded their profit margins, with QCT's EBT margin rising 3 points to 29% and QTL's improving 4 points to 72%. The company's overall operating margin increased from 22% to 26%, reflecting improved cost management and operational efficiency. Qualcomm's growth was primarily fueled by 5G adoption and expansion into automotive and IoT markets. However, challenges persist, including customer vertical integration, U.S.-China trade tensions, and ongoing patent licensing negotiations. The company's focus on 5G leadership and diversification into new markets positions it well for future growth, despite competitive pressures and geopolitical uncertainties.
Risk Assessment
The top 3 key risks for QUALCOMM Incorporated are:
1. Concentration of revenues from a small number of customers, particularly for premium tier handsets. Loss of major customers or reduced demand could significantly impact revenues and profitability.
2. Intense competition in the semiconductor industry, with competitors developing their own integrated circuits or using alternatives. This could reduce demand for Qualcomm's products and negatively affect market share and pricing.
3. Dependence on patent licensing and potential challenges to Qualcomm's licensing practices. Changes to patent laws, unfavorable rulings in litigation, or forced modifications to licensing terms could substantially harm the company's high-margin licensing business and overall financial results.
Key Data
| Rating | Buy |
|---|---|
| Target Price | 100 - 100 (md. 99.5) |
| 10m avg daily vol (mn) | 2.31 |
| Closing Price (USD) | 177.36 |
| Market Cap (USDmn) | 3122423.59 |
| 52 Week Price Range (USD) | 711.17 - 96.13 |
| BVPS (USD) | 18d.11 |
| Short Interest (mn) | 2.72 |
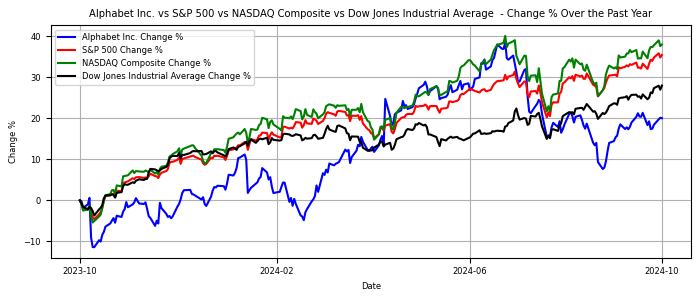
Share Performance
Top Competitors
- Jones Incorporated (JLL)
- Wake plc (WP)
- International Group Inc. (IG)
- TTT Group, Inc. (TTG)
- New Associates Limited Partnership (NAL)
Financial Metrics
| FY(USD mn) | 2019 | 2020 | 2021 | 2022 | 2023 |
|---|---|---|---|---|---|
| Operating Revenue | 1399.00 | 1659.00 | 1944.00 | 2182.00 | 2455.00 |
| Adjusted Net Profit | 314.00 | 227.00 | 292.00 | 369.00 | 374.00 |
| Adjusted EPS | 0.87 | 0.60 | 0.75 | 0.93 | 0.92 |
| EBIT Margin | 0.26 | 0.17 | 0.22 | 0.21 | 0.11 |
| ROE | 0.09 | 0.04 | 0.05 | 0.05 | 0.05 |
| PE Ratio | 68.97 | 154.94 | 105.93 | 82.88 | 94.53 |
| EV/EBITDA | 43.85 | 80.21 | 49.19 | 45.45 | 80.33 |
| PB Ratio | 6.38 | 6.55 | 5.43 | 4.46 | 4.83 |
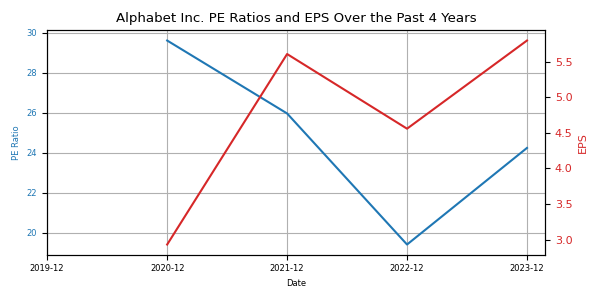
PE & EPS