2024-10-31
Amazon.com Financial Report 2024 Q3
Company Description
Amazon operates in e-commerce, cloud computing, digital streaming, and artificial intelligence. Its core strengths include customer-centricity, innovation, operational excellence, and long-term thinking. Key services include online retail, Amazon Prime, AWS, and advertising.
Current trends include the growth of e-commerce and cloud adoption, which present opportunities for Amazon. Challenges include economic uncertainty, regulatory scrutiny, and intense competition.
Recent initiatives include expanding same-day delivery, investing in AI and robotics, and launching new AWS services. Amazon has also focused on improving profitability through cost optimization and increasing advertising revenue.
In response to market conditions, Amazon has invested in fulfillment and delivery infrastructure, enhanced its Prime offering, and expanded internationally. The company continues to innovate in areas like voice technology, autonomous delivery, and healthcare while navigating economic headwinds through strategic cost management.
Business Highlights
Amazon's three main business segments showed strong performance:
North America sales grew 9% in Q3 2024, driven by increased unit sales, third-party seller activity, advertising, and subscriptions. This reflects Amazon's focus on price, selection and convenience for customers.
International sales increased 12% in Q3 2024, also due to higher unit sales, third-party sellers, advertising and subscriptions. The growth demonstrates Amazon's continued expansion and success in global markets.
AWS sales rose 19% in Q3 2024, primarily from increased customer usage. This highlights AWS's strong position in the cloud computing market, though pricing changes from long-term contracts partially offset growth.
Overall, Amazon saw 11% year-over-year revenue growth in Q3 2024 to $158.9 billion, with operating income increasing to $17.4 billion, showing strength across its core retail and cloud businesses.
Income Summarization
Amazon demonstrated robust financial performance in Q3 2024, with overall revenue growing 11% to $158.9 billion and operating income surging 56% to $17.4 billion. 1) Revenue growth: North America sales rose 9% to $95.5 billion, International increased 12% to $35.9 billion, and AWS grew 19% to $27.5 billion. 2) Profitability: All segments showed significant profit improvements, with North America's operating income up 31%, International turning profitable, and AWS increasing 50%. 3) Key drivers: Increased unit sales, third-party seller activity, advertising, and subscription services fueled growth across segments. 4) Operational efficiency: Cost management and fulfillment network optimization contributed to margin expansion. 5) Strategic focus: Continued investment in AWS infrastructure and emphasis on customer value proposition support future growth. However, macroeconomic factors and intensifying cloud competition pose potential risks to sustained performance.
Risk Assessment
The top 3 key risks for Amazon.com, Inc. are:
1. Intense competition across multiple industries and geographies, which could reduce sales and profitability.
2. Rapid expansion straining operations, management, and resources, potentially damaging reputation and limiting growth.
3. Complex regulatory environment with evolving laws on taxation, privacy, data protection, competition, and other areas, exposing the company to potential investigations, penalties, and business restrictions.
These risks stem from Amazon's diverse business model, global presence, and dominant market position, potentially impacting its financial performance and operations significantly.
Key Data
| Rating | Buy |
|---|---|
| Target Price | 100 - 100 (md. 99.5) |
| 10m avg daily vol (mn) | 2.31 |
| Closing Price (USD) | 177.36 |
| Market Cap (USDmn) | 3122423.59 |
| 52 Week Price Range (USD) | 711.17 - 96.13 |
| BVPS (USD) | 18d.11 |
| Short Interest (mn) | 2.72 |
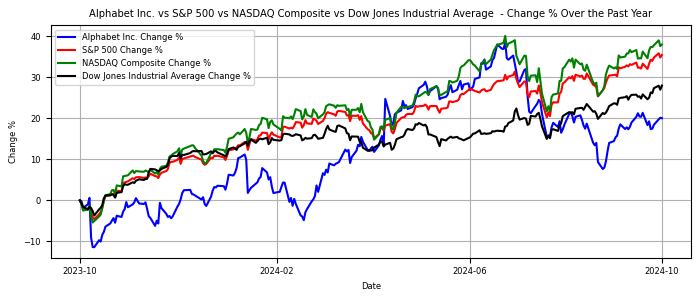
Share Performance
Top Competitors
- Jones Incorporated (JLL)
- Wake plc (WP)
- International Group Inc. (IG)
- TTT Group, Inc. (TTG)
- New Associates Limited Partnership (NAL)
Financial Metrics
| FY(USD mn) | 2019 | 2020 | 2021 | 2022 | 2023 |
|---|---|---|---|---|---|
| Operating Revenue | 1399.00 | 1659.00 | 1944.00 | 2182.00 | 2455.00 |
| Adjusted Net Profit | 314.00 | 227.00 | 292.00 | 369.00 | 374.00 |
| Adjusted EPS | 0.87 | 0.60 | 0.75 | 0.93 | 0.92 |
| EBIT Margin | 0.26 | 0.17 | 0.22 | 0.21 | 0.11 |
| ROE | 0.09 | 0.04 | 0.05 | 0.05 | 0.05 |
| PE Ratio | 68.97 | 154.94 | 105.93 | 82.88 | 94.53 |
| EV/EBITDA | 43.85 | 80.21 | 49.19 | 45.45 | 80.33 |
| PB Ratio | 6.38 | 6.55 | 5.43 | 4.46 | 4.83 |
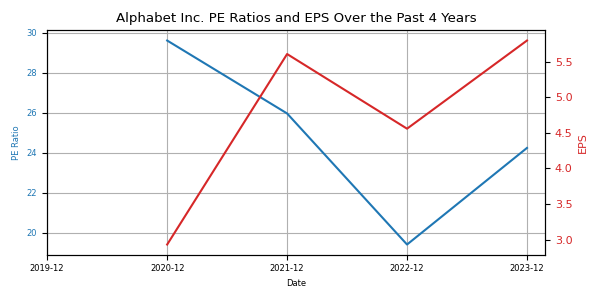
PE & EPS